What Leo saw at Apache, 1. The report 211 project leads rebuild by hand
Every quarter, each of Apache's 211 project leads writes a board report. Leo heard from every one and saw the same thing nearly 90 times: last quarter's report carried forward by hand, with figures the foundation already holds retyped beside it.
The Apache Software Foundation runs more than 200 open source projects, from its HTTP Server to Kafka, Spark and Cassandra. Its board meets every month, and every project reports to it each quarter. The minutes are public.
We gave Leo the board's 2019 minutes, and taught each of the 211 project chairs to it as a person of their own, so it heard from each one separately, the way a company's managers each write their own report. This is the first thing it saw that only reading all of them together would show.
The Apache Software Foundation had no part in this
We used the foundation's board minutes because they are public. The ASF did not take part, and nothing here is the ASF's view of Leo. Every quote below links back to the minutes it came from.
The claims, and where to check them
| Claim | Where to check it |
|---|---|
| Every Apache project reports to the board each quarter; in 2019 that was 211 project chairs | The Apache board minutes, 2019 (the minutes archive) |
| Leo found the same pattern nearly 90 times, report by report: most of each report carried forward word for word, and the figures retyped from records the foundation already holds | Leo's brain, from the 2019 minutes |
| The same quarter's figures disagreed from one report to the next, for example 1,787 issues emails in February against 1,751 quoted for the same quarter in May | The 2019 minutes, Ambari's reports |
| In 2020 chairs began pointing the board to the foundation's statistics page instead of typing every figure, while some still counted by hand | Minutes, 21 Oct 2020 |
| In 2023 a project found it had carried the same mailing list numbers forward for over a year | Minutes, 18 Jan 2023 |
The work as it was
Every quarter, each chair writes a report for the board: what the project is, how the community is doing, who joined, what was released, how busy the mailing lists and issue trackers were.
Most of it does not change. A project's description is the same every quarter. So are many of the paragraphs that follow. And the figures that do change, mailing list counts, issues opened and closed, the last release, the last person added, are already held in the foundation's own records. The chairs gather them by hand, and copy last quarter's beside them.
So the numbers drift. One project's report gave 1,787 emails on its issues list for the quarter to February; the next report gave the same quarter as 1,751. Another gave a previous quarter's developer emails as 575, where the report before had said 632.
What Leo saw
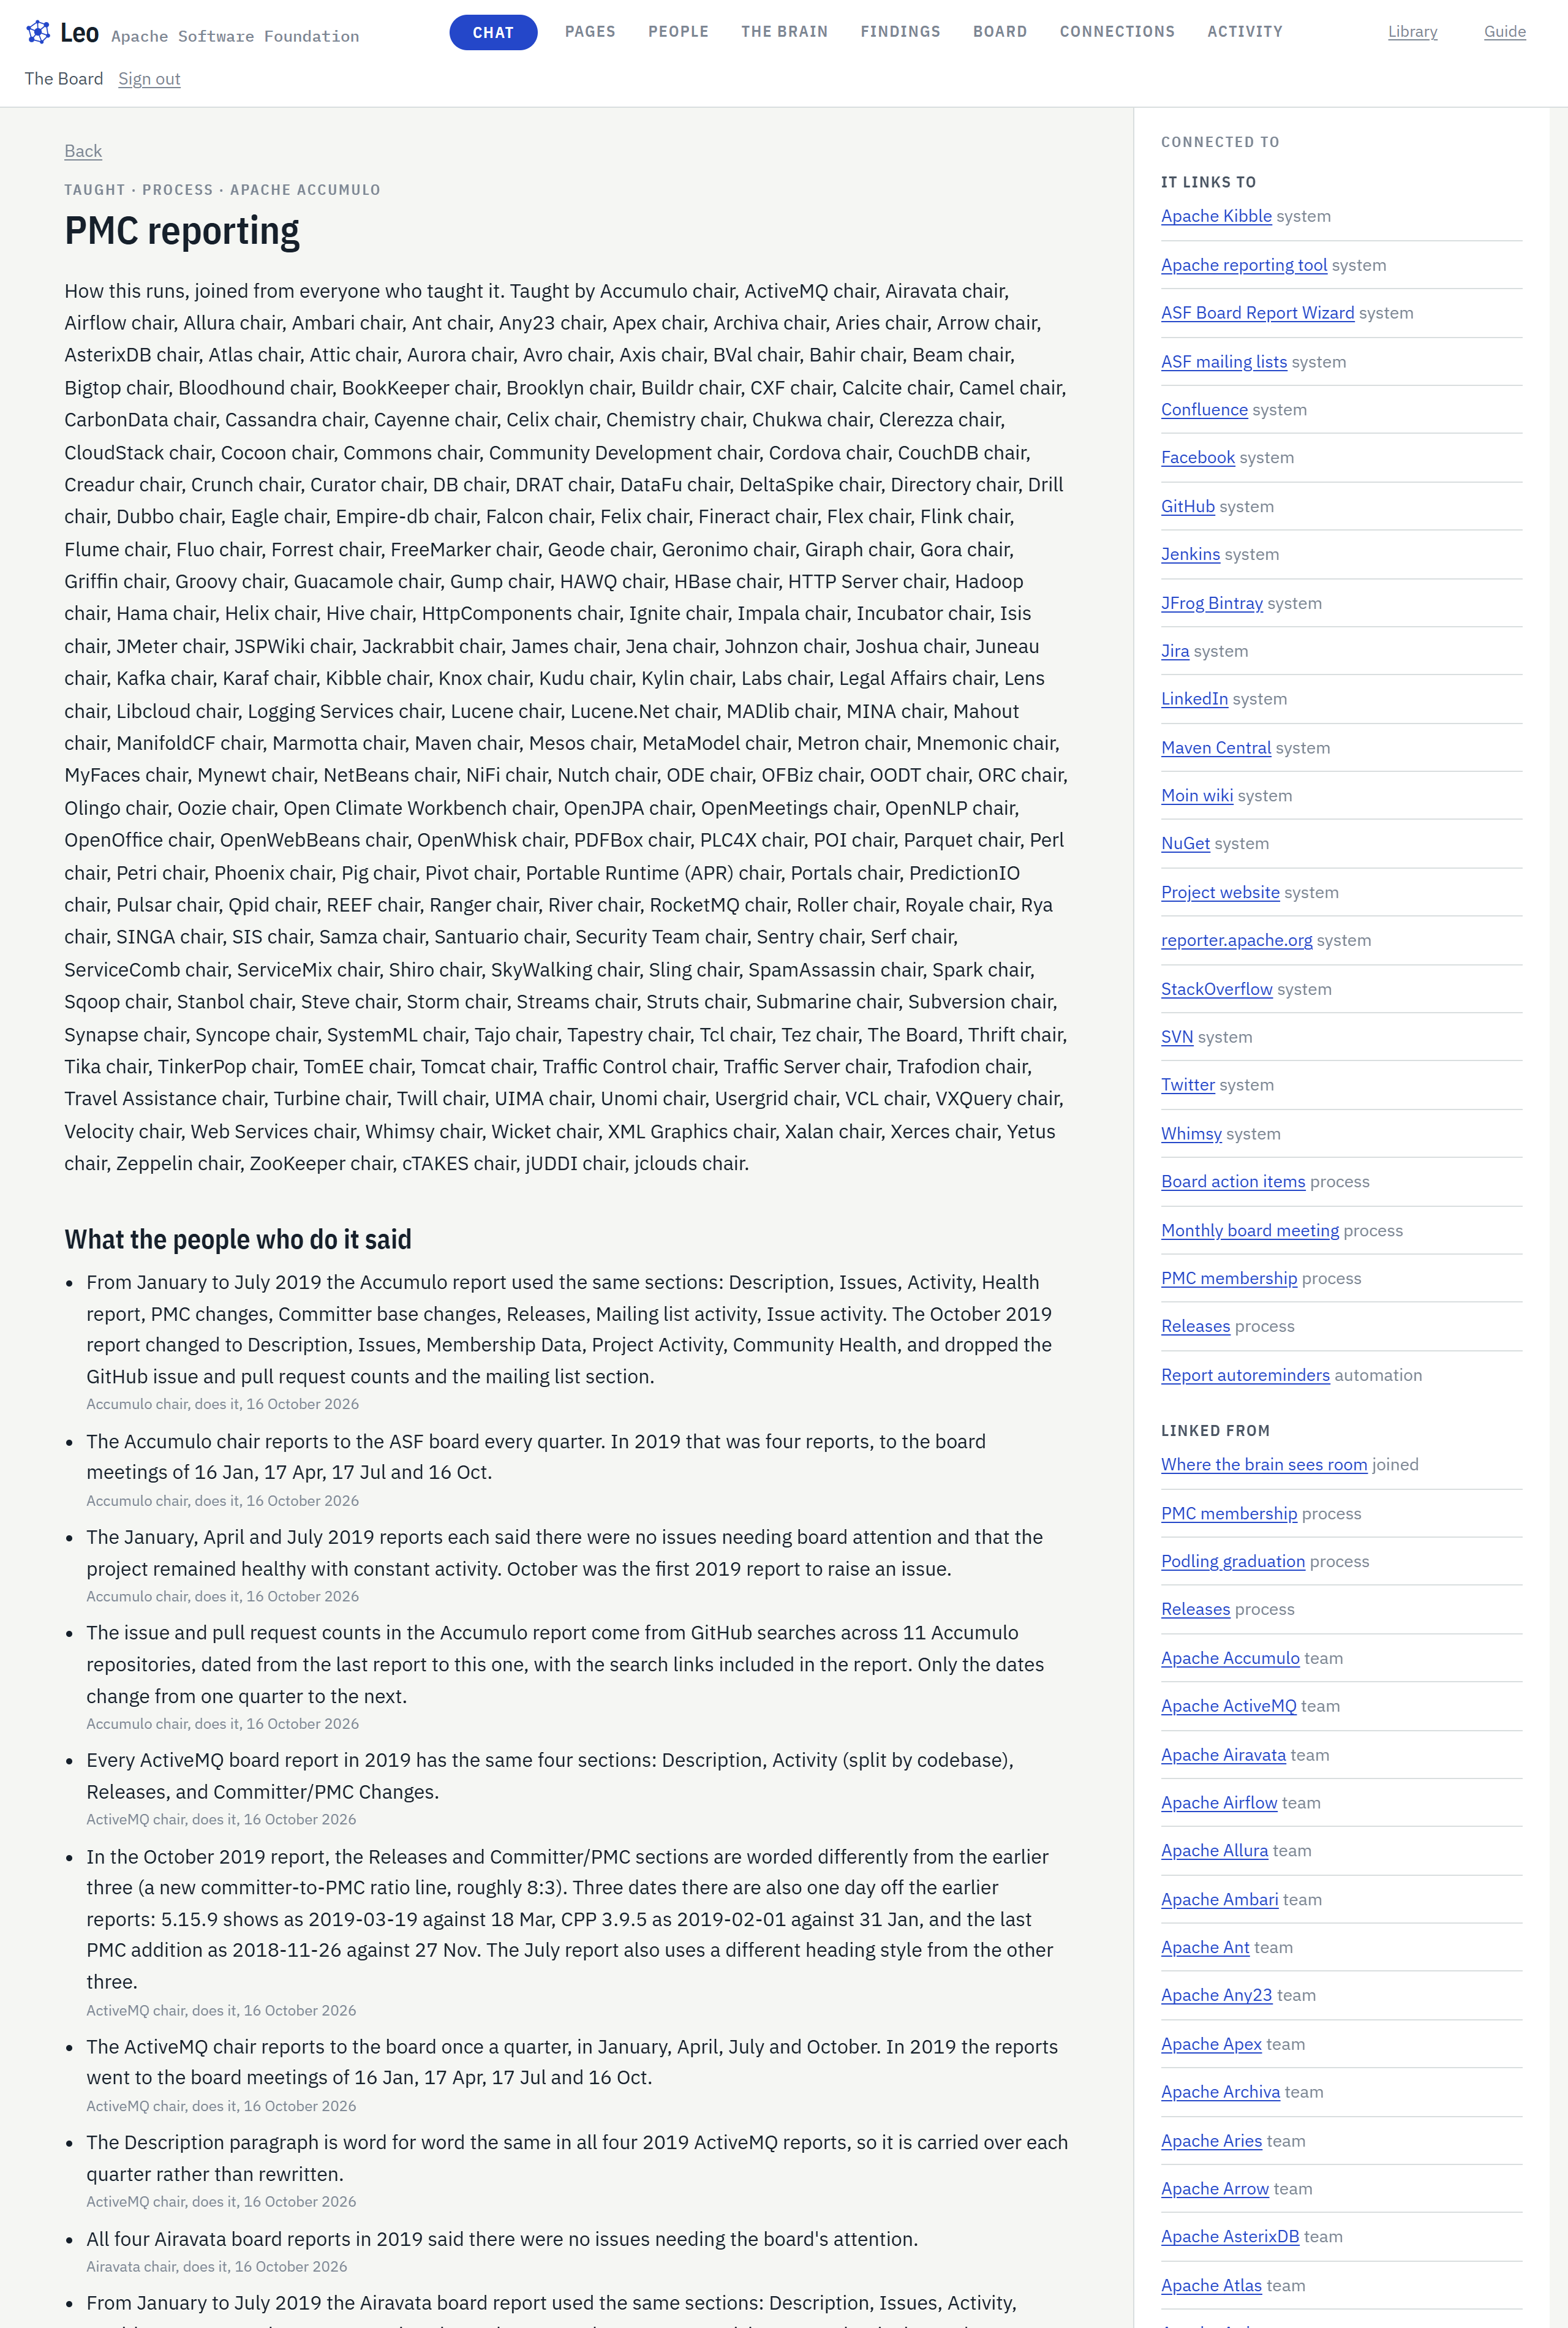
Leo did not see this once. It saw it nearly 90 times, report by report, chair by chair: "Most of each Maven board report carries forward", "Most of each Tomcat board report is carried forward word for word", "The JIRA counts are the same seven key query each quarter with only the date changed." Each chair was rebuilding the same document, alone.
The ways forward
- Improve: the report arrives prefilled. The parts that never change, and the counts the foundation already holds, are filled in; the chair writes only what happened. Leo laid this out for each of those projects in its own terms.
- Redesign: hold the fixed facts once. A project's description, founding date and last additions are kept once and shown beside every report, so the report carries only what changed.
- Eliminate: the chair stops typing the counts. The board agenda shows the figures straight from the foundation's statistics over one fixed window, and the chair adds only what they mean.
What happened next
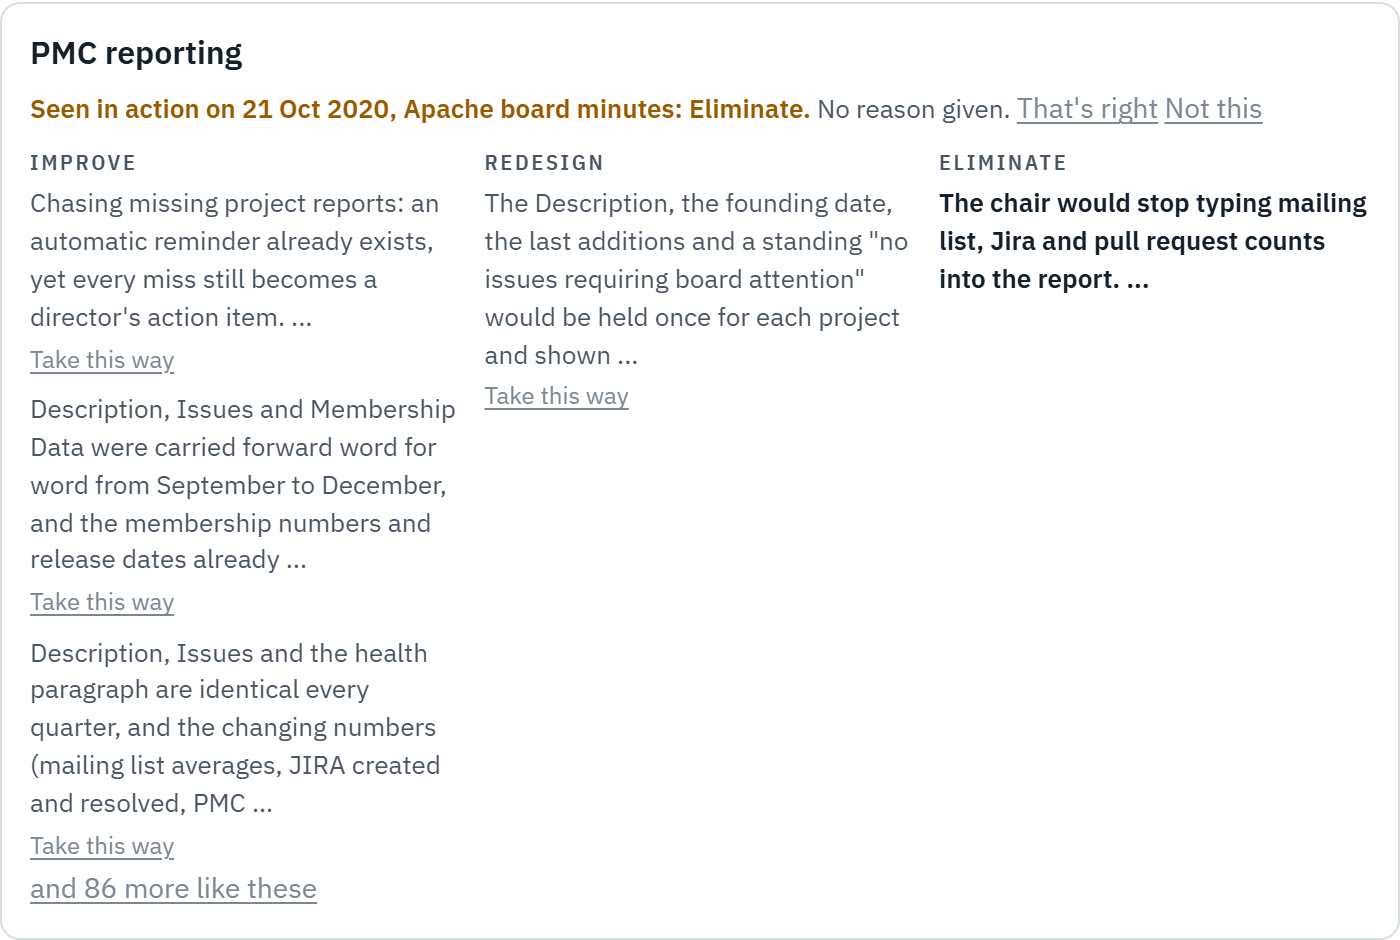
- 2020. Some chairs began pointing the board to the foundation's statistics page instead of typing every figure. Not all trusted it: "I count the metrics manually," wrote one, in October.
- 2022. The automatic figures were not always there when needed: "Automatic activity metrics... seems to stuck, so activity estimation is approximate."
- 2023. One project discovered the cost of carrying numbers forward: "Our last three board reports have had inaccurate mailing list numbers." Another left its mailing list figures out, because the statistics page was not up to date. In May the board added a required item to every report, the project's state, chosen from a fixed list.
So part of the third way happened on its own, report by report: the figures moved toward the shared statistics. The reports themselves were still written by hand.
What this does not show
The minutes show what chairs wrote, not how long it took them, or what tools some used privately. Volunteers write these reports in their own time, and a foundation run by volunteers has good reasons to change slowly. What the record shows is the same work done separately more than 200 times a quarter, figures drifting because of it, and a shared source that existed but was not yet trusted.
Leo learns how an organisation really runs by hearing from each of its people, then lays out the ways the work could go, side by side, and keeps the choice with the people who make it. When they take a path, its card records it, including one Leo did not offer.